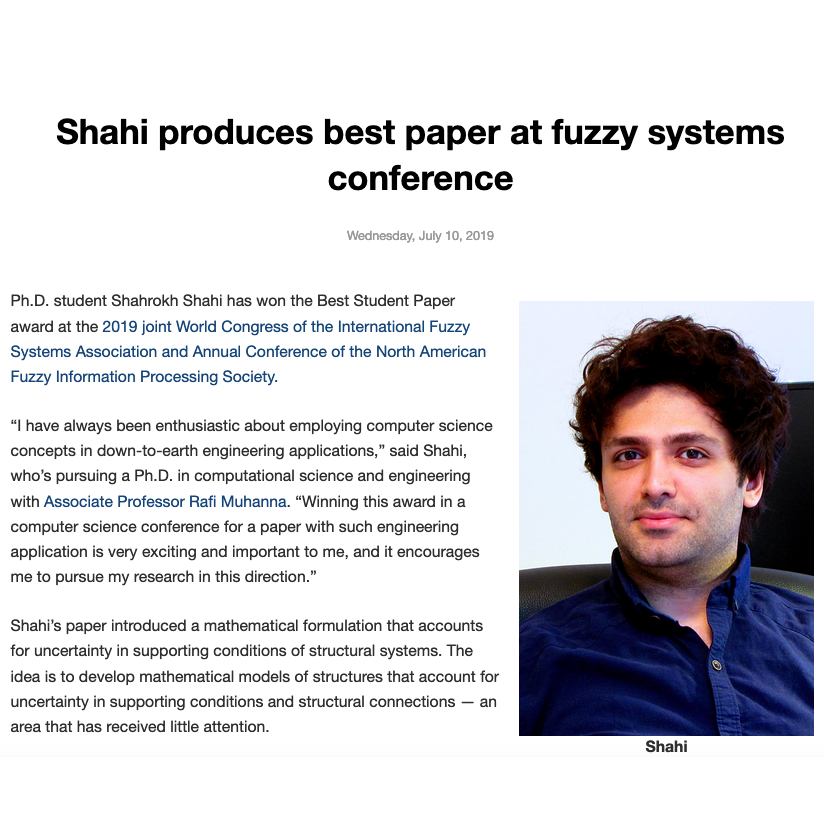
Shahrokh Shahi
shahi@gatech.edu
Hello there! Every person has their own unique story. Here is a glimpse into mine. My name is Shahrokh /ʃɑ:hroʊk/ but my friends also call me Shah and Sean and I really like, and used to be called, both of them!
I’m a PhD candidate in Computer Science/Computational Science and Engineering (CSE) in the College of Computing at Georgia Institute of Technology, supervised by Elizabeth Cherry. Prior to starting my PhD, I have been a postgrad student at Imperial College London where I earned my second Master’s degree in Computer Science supervised by Alessandra Russo and Mahdi Cheraghchi.
As a person who maintains a life-long passion in computer science and who is also interested in engineering topics and real-world applications of computer science concepts, Computational Science and Engineering (CSE) has been my first and only major to pursue my PhD in, immediately after earning two Master’s degrees, one in Structural Engineering and another in Computer Science.
Here at Georgia Tech, my research interests mainly include, but not limited to Deep Learning, Data Visual and Analytics, and their applications in addressing real-world problems. Particularly, I have been working on developing Interval Deep Neural Networks to account for uncertainty in the input imprecise data. Currently, I’m working on developing robust Reservoir Computing techniques, such as hybrid Deep Echo State Networks, to predict the dynamics of complex systems with partial observability and imprecise data, such as cardiac electrical waves, markets and finance data, etc. Apart from my research, I have also been working as a software developer and enjoying freelance consulting jobs.
Education and Experience
-
PhD - Georgia Tech 2018 - presentCurrently, I am a Ph.D. student in Computational Science and Engineering (CSE) at Georgia Institute of Technology
Major: Computer Science - CSE
-
Software Developer 2016 - presentAfter graduating from Imperial College London and before starting my PhD, I worked as a software developer at Alpha Quant company
I have also been working as a full stack web developer -
Imperial College London 2015-2016M.Sc. in Computing Science
Distinction (First Class Honour)
Thesis: Algorithms for Graph Partitioning -
University of Tehran 2013 - 2014
-
University of Tehran 2010 - 2013M.Sc. in Structural Engineering,
Thesis: Multiscale Simulation of Biomechanical Systems; Human Heart Valves -
University of Tehran 2006 - 2010B.S. in Civil Engineering
-
NODET 2006 - 2010NODET (National Organization for Development of Exceptional Talents)
Highschool and Pre-university, major in Mathematics and Physics
Skills
(1) Programming Languages:
-

Python -
MATLAB -

Java -

C++ -

Bash -

Fortran -
VB -

Julia -

Perl
| (+10 years) |
|
|---|---|
(5 to 10 years) |
|
| (1 to 5 years) |
|
| (Less than 1 year) |
|
(2) Machine Learning, Data Visual & Analytics:
-
TensorFlow -
Scikit-Learn -

D3 -

AWS -

Hadoop -

Hive -

Spark/Scala -

Hbase -

SQLite -

OpenRefine -

Tableau -

Gephi -

Microsoft Azure -

Azure ML Studio
| (1 to 5 years) |
|
| (Less than 1 year) |
|
(3) Web Development:
-

Html -

CSS -

Javascript -

jQuery -

django -

Flask -

Node.js -

Ajax
| (1 to 5 years) |
|
| (Less than 1 year) |
|
(4) App Development:
-
iOs/Swift -

Android
| (Less than 1 year) |
|
(5) Programming Tools & IDEs:
-

Git -

GitHub -
GitLab -

BitBucket -

Sublime Text -

Vim -

IntelliJ IDEA -
Eclipse -
Xcode
| |
|
(6) Engineering Softwares:
-
Abaqus/CAE -
SolidWorks -
Comsol Multiphysics -
HyperMesh -
AutoCAD
| (1 to 5 years) |
|
(7) Others:
Portfolio
The following is a few examples of the projects I have accomplished. There are lots of other projects that I'm going to add them to this collection. So, as long as you can see this text, this section is not complete yet and will be evolving and updating! Click on to see more details.
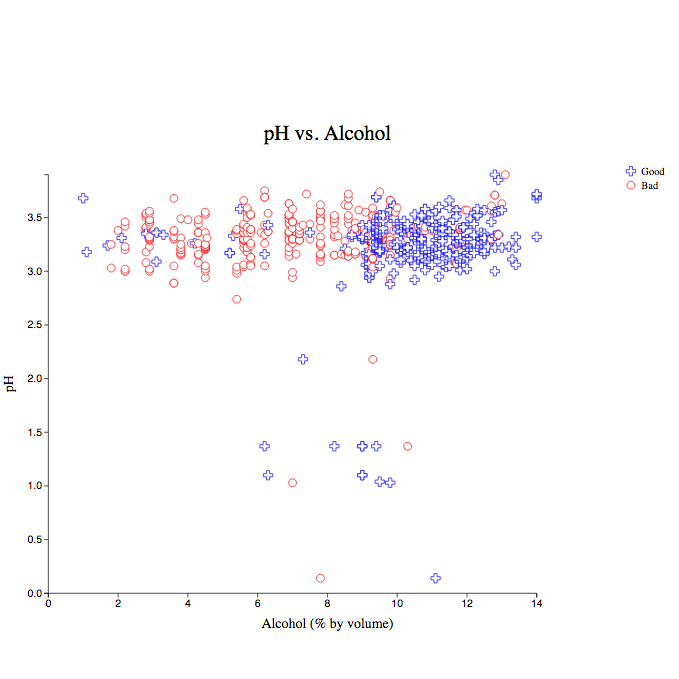
Density Estimation with KDE and GMM
First, running PCA on 13-dimensional "Wine Quality" dataset to reduce the dimension to two and visualize the multi-modal behaviour. Then, using the Expectation-Maximization (EM) algorithm to fit a Gaussian Mixture Model (GMM) to the data and comparing the results with Kernel Density Estimation (KDE) and Histogram
Traveling Salesman Problem (TSP)
Originally, it was a group project (group of four) in CSE Advance Algorithms course. Even though I was exempetd, I accomplished and submitted this project individually, and won one of the performance competitions. In this project, I developed multiple different algorithms (including Brute-Force, Branch-And-Bound, Approximation, and a variety of Local Search approaches) in Python. At the end, a comprehensive report is presented including algorithms details, empirical evaluations, accuracy tables and evaluation plots (QRTDs, SQDs, etc.).

MapReduce on AWS and Azure HDInsight
Multiple analysis on Google n-grams dataset to obtain statistical information using Apache Pig. At first, the interactive PIG shell has been used to check the procedure step-by-step on a smaller dataset through SSH, then the associated PIG script with all commands has been uploaded on the Amazon Elastic MapReduce (EMR). In a similar project, a MapReduce program to compute some metrics of a large social media (Friendster) graph has been implemented on Microsoft Azure HDInsight in which I developed a Hadoop code in Java.

On-line Learning of User Privacy in Social Networks
Developing a web plugin implementing a Parametric Markov Chain (PMC) model to evaluate the privacy risk and social benefit of sharing information with friends in a social network. In this project, Facebook is considered as the main case study. Accordingly, the Facebook Graph API and related libraries have been employed in the developed Java code to create the back-end.
Algorithms for Graph Partitioning: Theory and Practice
A systematic study of the major techniques and discoveries in the field of Graph Partitioning algorithms, with an emphasis on the Spectral Graph Theory. Application in clustering and community detection in social networks, and also load balancing in parallel computations. (Master's Thesis in Computer Science)
Designing and Development of a Mobile Robot
Employing robotic kits and Raspberry Pi single board computers to implement robotics concepts, such as wheeled configuration and uncertainty in movement, using sensors to implement reactive behaviors and considering probabilistic localization filters and place recognition concepts,etc. Programming in Python.